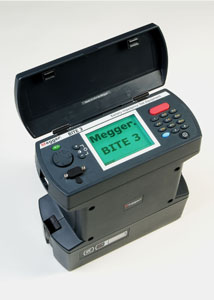
Megger BITE 3 Battery Testers

Follow us for the latest equipment specials.
New Megger BITE 3

Sell Equipment Repairs Add to cart E-mail this page Alert me when this goes on sale
Megger BITE 3 Details
Megger BITE 3
The Megger BITE3 Battery Impedance Test Equipment determines the health of lead-acid cells up to 2000 Ah by taking measurements of the most important battery parameters. The BITE 3 measures cell impedance, an internal ohmic test, cell voltage, intercell connection resistance and ripple current. And, for the first time in a battery instrument, the BITE 3 measures float current and the harmonic content of the ripple current. There is even a built-in spectrum analyzer to show the harmonic content of the ripple current. It has firmware that can be upgraded through the Internet and supports multiple languages.
The BITE 3 is one of the easiest instruments to use. Its measurements, along with temperature, specific gravity and other battery data, can provide the best basis for evaluating the overall health of batteries from terminal plate to terminal plate and to a lesser extent, the charger (from ripple current and its harmonic content.) Megger recommends that the BITE 3 be made part of a comprehensive battery maintenance program with readings taken and recorded semi-annually for flooded, lead-acid cells and quarterly for VRLA.
Unlike load-cycle testing which is expensive, nonpredictive and time-consuming (but does provide actual capacity data), the BITE 3 is quick, reliable and easy to use. With a rapid test time, one person can easily, quickly and precisely measure cell and string parameters without taking the system off line. Furthermore, in as little as four keystrokes, the instrument is ready to take battery measurements (five, if the power button is included). The processor of the BITE 3 uses a Windows CE Operating System and can store more than 1 million cells data in any string configuration. It is menu-driven that is easy to navigate. Its unique data analysis screens provide immediate feedback on the status of cell impedance, (see Figure 1, Battery Analysis Report). The first part of the report is the numerical data. The second part is the impedance deviation graph and the third part is the impedance deviation graph but in ascending impedance order. The ascending impedance graph groups the weakest cells together for easier analysis. With the optional printer, this report can be printed by the user and left at the site as a record for future reference.


